In this tutorial we will discuss about automating the Interactive Charts and SVG [Scalable Vector Graphics] in Selenium.
To automate these Interactive Charts, Selenium Locators such as Xpath and Css-Selector are not helpful. We should depend on an Interface called JavascriptExecutor to identify the SVG and read the values available in these charts.
Javascript Commands:
Reading Attributes of SVG graph[Scalable Vector Graphics]
document.getElementsByTagName('svg')[0].getAttribute('class')
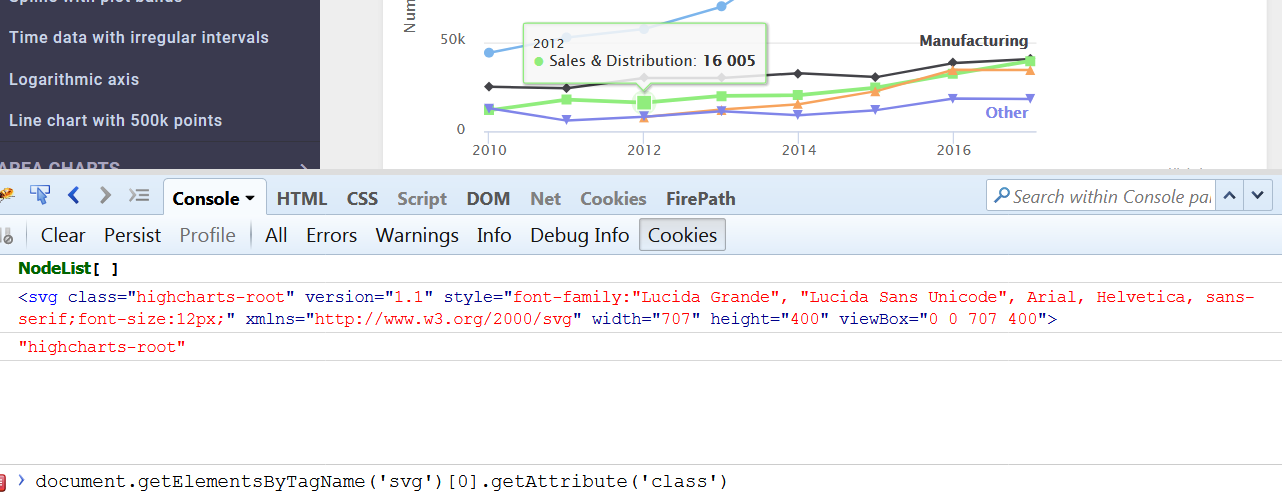
Scalable Vector Graphics – SVG
Reading Data from the Chart
document.getElementsByTagName('path')[0].getAttribute('d')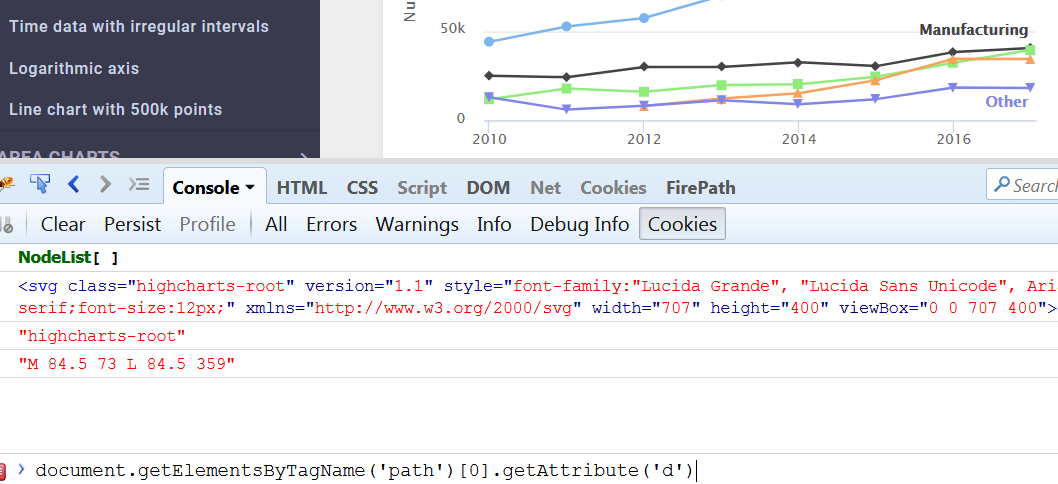
Interactive Chart-Line Chart
Executing the Javascript Commands in Selenium WebDriver
|
1 2 3 4 5 6 7 8 9 10 11 12 13 14 15 16 17 18 19 20 21 22 23 |
import org.openqa.selenium.JavascriptExecutor; import org.openqa.selenium.WebDriver; import org.openqa.selenium.firefox.FirefoxDriver; public class HandlingInteractiveCharts{ public static void main(String[] args) { WebDriver driver = new FirefoxDriver(); driver.get("https://www.highcharts.com/demo/line-basic"); //JavascriptExecutor is an interface JavascriptExecutor jse = (JavascriptExecutor) driver; Object o = jse.executeScript("return document.getElementsByTagName('path')[0].getAttribute('d')"); String s = (String) o; System.out.println(s); o = jse.executeScript("return document.title"); s=(String) o; System.out.println(s); } } |
Output:
M 84.5 73 L 84.5 359

Basic line | Highcharts
References:
JavaScript HTML DOM Document
Interactive Charts
Conclusion:
Therefore, using Javascript Commands we can automate the SVG and Interactive Charts in Selenium.
Thank you for explaining how to execute javascript command in selenium. I wanted to know how to validate the results? Compare the output against what? How to decide on the expected result?
Can this be achieved with C# in selenium? Also how to validate the results and compare against expected result?
i did not understan anything. what is (‘path’)[0].getAttribute(‘d’). how you identified these?